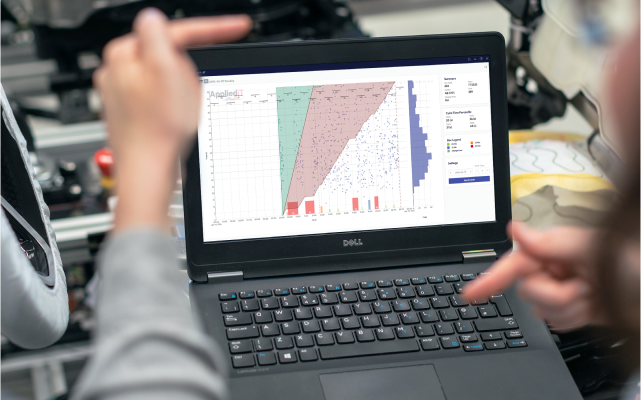
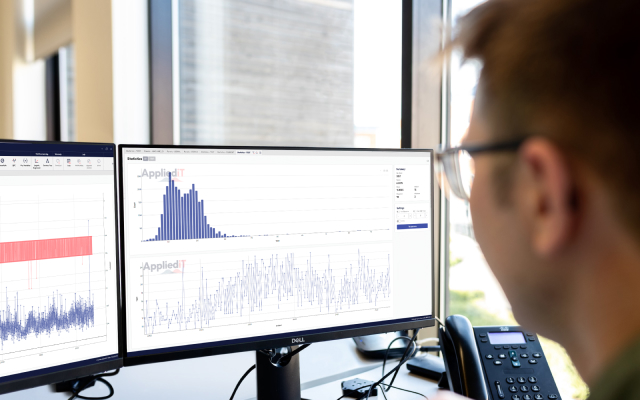
Data visualization is a tool that allows us to explore and communicate information visually. It helps us discover patterns, trends and opportunities, and communicate our findings effectively.
Data visualization solutions for
industry 4.0
Would you know how to choose the best data visualization solution for your business? There are many options on the market, but not all of them offer the same advantages and functionalities. Below, we present some criteria that you should take into account when selecting the most appropriate tool for your needs.
Easy to use
The data visualization solution you choose should be easy to use, without requiring advanced technical knowledge or a long learning curve. It should allow you to create and customize your visualizations quickly and intuitively, with a friendly interface.
Flexibility
On the other hand, it must be flexible, capable of connecting with different data sources, whether local or in the cloud, structured or unstructured, in real time or historical.
It should allow you to combine and transform your data easily, without losing quality or precision. In addition to offering you the possibility of exporting and importing your visualizations in different formats, such as PDF, PNG, HTML or CSV, so you can easily share them with your team, clients or partners.
Performance
Performance is another important aspect. The tool must be able to handle large volumes of data without compromising performance or security. You must also have a robust and reliable platform that ensures data availability, integrity and privacy.

How to choose the best data visualization solution?
The data visualization solution you choose should offer you more than just graphs. It should offer you advanced analysis tools that allow you to explore, analyze and discover valuable insights in your data. It should allow you to apply statistical, mathematical and artificial intelligence functions to your data, so you can get answers to your business questions.
Additionally, it should offer you the option to create interactive and dynamic dashboards, which automatically update with the latest data, so you can monitor and control your key performance indicators (KPIs).
RTM Pro, the safe choice for advanced data analytics
Is there a data visualization solution that meets all of these criteria?
Yes, it exists, and it’s called RTM Pro.
It is known as the best tool on the market for data visualization and interpretation, since it meets the necessary requirements and is used by large companies around the world. Its differentiation with the rest is measured in the following points:
- It’s easy to use: You can create and customize your data visualizations in minutes, with just a few clicks. Choose from a wide variety of charts, use drag and drop to move, sort and group your charts, and create dashboards that are attractive and cohesive.
- It is flexible: It offers the ability to connect to any data source, whether it is a local file, a database, or a spreadsheet. You can combine and transform your data easily and quickly, with the help of predefined or custom functions. In addition, it allows you to export and import your visualizations in different formats, such as PNG, SVG or CSV, so you can share them with whoever you want, when you want and how you want.
- Reliable performance: It allows you to handle large amounts of data without problems, thanks to its architecture, which guarantees high speed, low latency and high security.
- Offers advanced analysis: See more than your data, understand it, and discover the power of harnessing it. Apply statistical, mathematical, and AI functions to your data, so you get relevant, actionable insights. On the other hand, from RTM Pro you have the possibility of creating interactive and dynamic panels, which are updated in real time with the most recent data, so that you can monitor and control your KPIs. It is prepared for everyone, through the narrative function, you will be able to obtain a textual summary of your visualizations, so that you can communicate your findings clearly and concisely.

Conclusion
In summary, RTM Pro stands out as the outstanding choice for data visualization in the enterprise field, being used by large companies such as AIRBUS, Continental, Lindner, Vitesco… Its unique combination of ease of use, flexibility, performance and advanced capabilities of analytics, they position it as the ideal tool to make the most of your data, standing out among all the others.
With RTM Pro, transforming complex data into clear visual narratives becomes an intuitive experience.
Don’t miss the opportunity to enhance your decisions and achieve your goals efficiently. What are you waiting for? Immerse yourself in the world of possibilities that RTM Pro offers today. Now you can request a free demo!
Share this post


