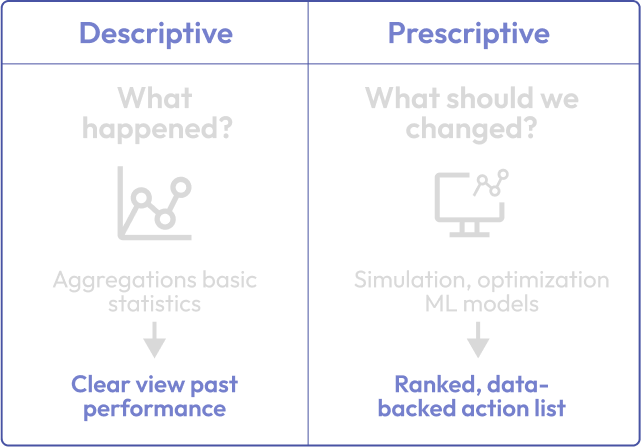
Most plants already track every sensor, cycle time, and defect. Descriptive analytics turns that history into tidy dashboards—useful, but backward-looking.
Prescriptive analytics adds the missing piece: Algorithm-driven advice on what to do next.
Moving from “What happened?” to “What should we do now?” is becoming a baseline requirement for factories that want higher throughput, lower cost, and fewer surprises.
Introduction to Complex Problem Solving in Quality Management

However, to understand it better, let’s define what the difference is between one and the other.
- Descriptive analytics is the plant historian. It tells you last month’s OEE, scrap rate, or energy use.
- Prescriptive analytics is the process engineer who has already run a thousand “what-if” scenarios overnight and walks in with the top three parameter changes that will hit the target at minimum cost.
Both approaches are incredibly valuable, but understanding their differences is key to applying the right tool at the right time.
Example: Cutting Weld-Line Downtime at a Tier-1 Supplier

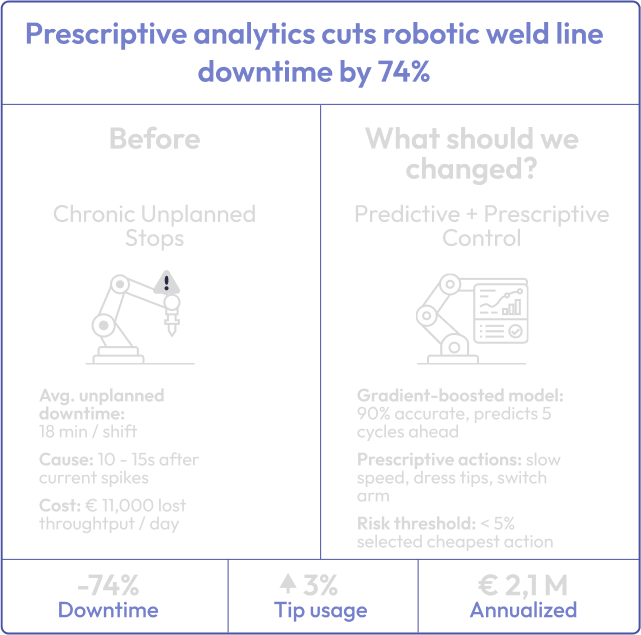
A Tier-1 supplier that stamps and welds chassis components for several OEMs had chronic unplanned stops on its robotic weld line—averaging 18 minutes per shift.
Installing additional sensors gave the team a real-time feed on robot torque, arm vibration, and current draw.
1. Descriptive stage:
- Data showed most stoppages followed a spike in current draw 10–15 seconds earlier.
- Dashboard quantified the cost: €11 000 of lost throughput per day.
2. Prescriptive stage:
- A gradient-boosted model predicted a 90 % chance of failure five cycles in advance.
- An optimization layer balanced three actions—slowing arm speed, adjusting tip dressing interval, or switching the robot to backup duty—against takt-time targets and tip-life cost.
- The system recommended the cheapest action that held risk below 5 %. Operators accepted suggestions via an HMI button.

Why Prescriptive Pays Off — at a Glance
| Payoff | What It Looks Like on the Shop Floor. |
| Decision velocity | The solver has already compared thousands of parameter sets by the time the supervisor logs in, so changes go live while the line is still warm. |
| Resource tightness | Maintenance, tooling, and inventory levels are scheduled as one system, squeezing slack time and excess stock out of the budget. |
| Customer focus | Model outputs are weighted by order priority and penalty costs, steering production toward the highest-value jobs first. |
| Risk foresight | Scenario simulations flag weak links—whether it’s a paint-booth choke point or a Tier-2 chip shortage—days before they hit OEE. |
Building Blocks — a Four-Step Flow
1. Clean, time-stamped data:
Unify sensor, MES, and ERP feeds so every event shares one clock. Garbage in still means garbage out.
2. Predictive layer:
Machine-learning or physics-based models translate raw signals into forecasts of yield, demand, or failure probability.
3. Optimization engine:
Linear, mixed-integer, or stochastic solvers search millions of “what-if” combinations and surface the lowest-cost plan that meets constraints.
4. User interface:
Recommendations reach operators via HMI, mobile, or email—any channel that lets them act within seconds, not hours.
Getting Started
Audit a single high-impact asset. Map its data sources, failure modes, and KPI penalties. Develop a pilot model that recommends one change operators can test within a shift. Scale only after the economic case is proven in hard currency.
Prescriptive analytics shifts analytics from hindsight to foresight—and then to concrete instructions. In automotive manufacturing, where each minute of downtime ripples through just-in-sequence deliveries, that shift is no longer optional.
Share this post


